.svg)


Key takeaways
On this page


he sun is shining on all points of the globe, although with varying intensity in different regions. That is where a solar mapping tool really comes into play for those who would like to know how much sunlight their location receives. Below, let's see the benefits it has to offer people who are considering going solar.
What is a solar insolation map?
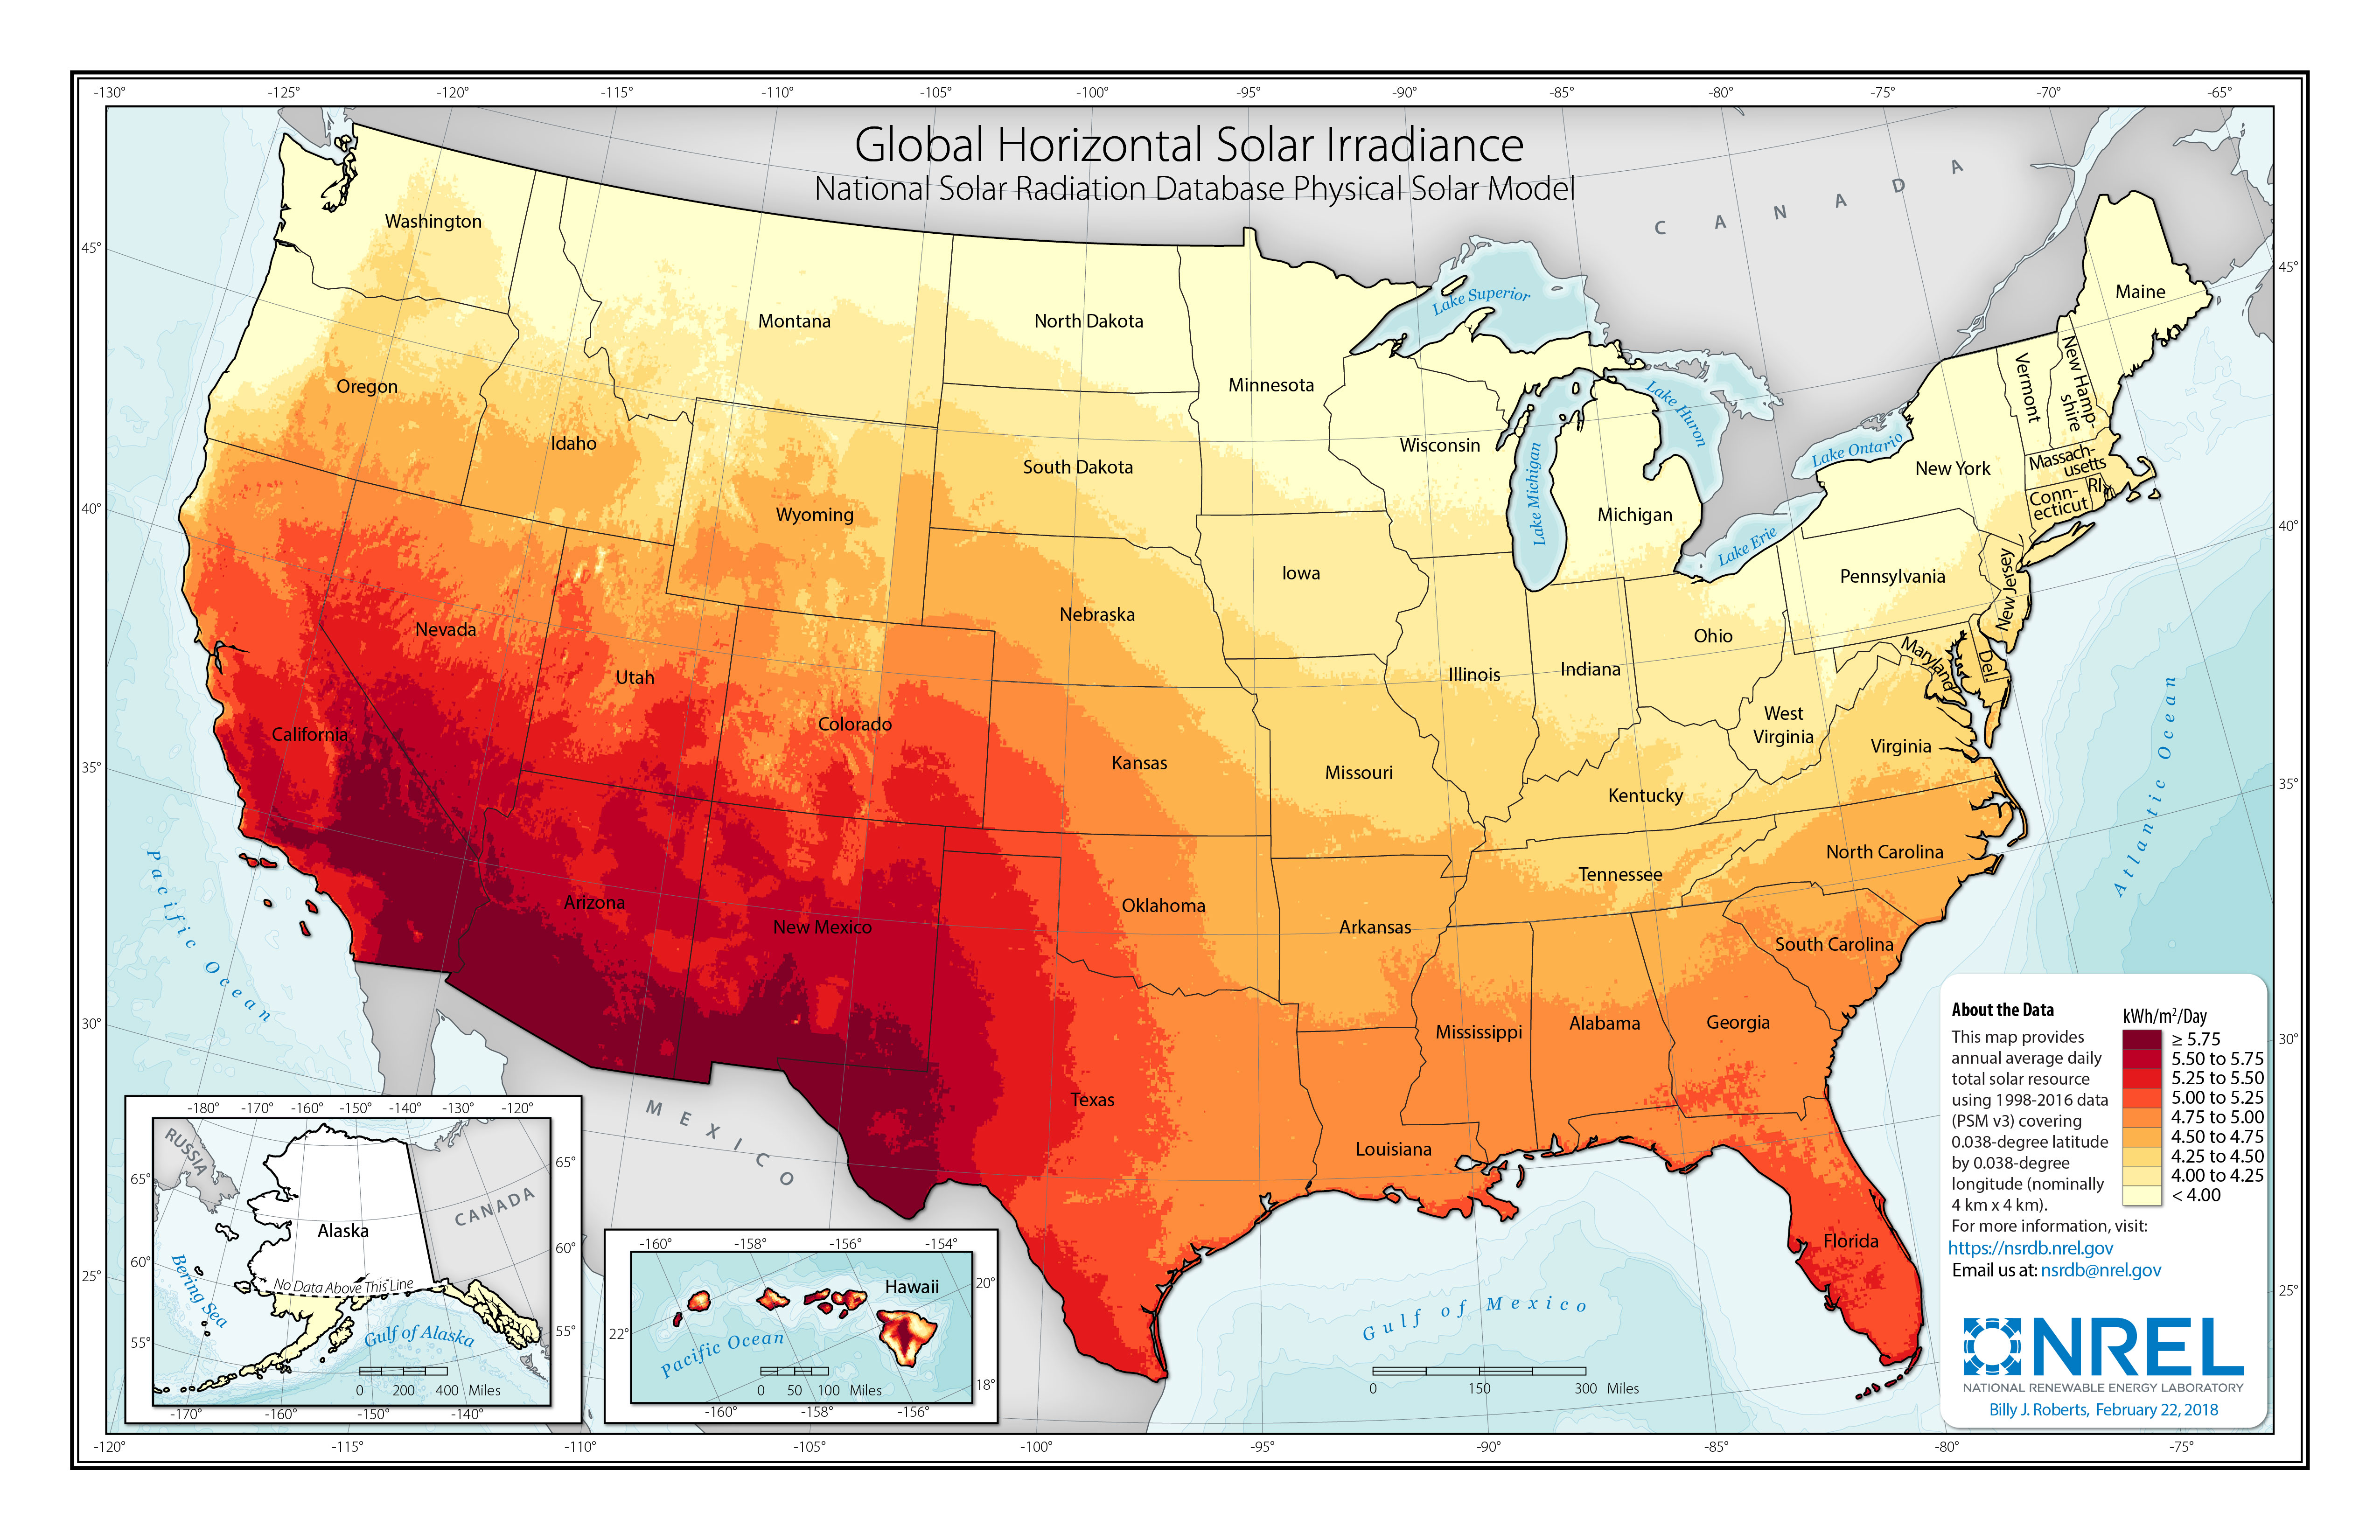
A sun map provides you with the basic information concerning solar resources in your area. A solar power map for a city, state, or country is a map that shows the amount of sunlight that this place receives on average. For instance, a sun map created by the NREL shows the average daily quantity of solar power across the U.S. measured in kilowatt hours per square meter. Another example of a sunlight map is Solar Mapper by SEIA.
When do you need a sun map?
These solar mapping tools may prove useful if you plan on buying a solar power system. With solar potential information at your disposal, you can easily make an estimate for the size of your photovoltaic power system through this simple formula: Average Daily Power Consumption ÷ Average Daily Peak Sun Hours ÷ Solar Panel’s Efficiency = Number of Panels your house requires to meet its power needs
What is a peak sun hour?
You may be receiving around 8 hours of sun daily in your location. It, however, doesn't mean that your location experiences 8 peak sun hours. In solar vocabulary, the term "peak sun hour" designates the intensity of sunshine and not its duration. In technical terms, one peak sun hour is equal to one hour of solar radiation averaging 1,000 W/m2.
Why do peak sun hours vary by area?
The equatorial territories typically get stronger sunlight; hence, most southern states in the U.S. get more extensive sun peaks compared to the northern ones. Sunlight is more intense in regions closer to the equator, which is why U.S. southern states generally experience more peak sun than northern territories. Apart from mere proximity to the equator, another condition that would affect the intensity of solar radiation is the number of cloud-free days. Across southwestern states, more days are clear of clouds, creating great conditions for solar power generation.
What are the average peak sun hours in my state?

Most of the states in the US receive between 3 to 5 peak sunlight hours per day. The table below shows the typical solar radiance of 10 randomly selected US states.
Anyway, it is just an average. One can easily find more precise data related to solar insulation and peak sun hours for any address using their ZIP code.
How many PSH should you have to go solar?
It's a no-brainer to opt for solar panels if your US home consistently gets 4 hours of peak daylight. But even if it's less according to the sun map, solar energy's benefits aren't off the table. There are many other variables affecting solar performance—panel type, size, orientation, angle, and so on. Thus, before you go wild and crazy about investing in photovoltaic panels, visit a solar installer who will offer a yield-feasibility estimate with expected savings.
Related

Key takeaways
Maximize Solar Potential: A Guide to Peak Sun Hours & Sun Maps
Solar Insolation Maps Explained:
- Solar mapping tools like NREL and SEIA's Solar Mapper showcase average daily solar power across the U.S.
- Solar irradiance, the sun's power output, is 1,366 watts per square meter at the outer atmosphere.
Determining Solar System Size:
- Use sun maps when considering a solar power system purchase.
- Calculate your PV system size with Average Daily Power Consumption ÷ Average Daily Peak Sun Hours ÷ Solar Panel’s Efficiency = Required Panels.
Understanding Peak Sun Hours:
- Peak Sun Hours measure sunlight intensity, not duration, with one hour of solar irradiance averaging 1,000 watts per square meter.
- Subsidies for solar panels make solar energy affordable, reducing upfront costs for homeowners and businesses.
Regional Variations in Peak Sun Hours:
- Sunlight intensity is higher closer to the equator, impacting peak sun hours.
- Southwestern states benefit from more cloud-free days, enhancing solar power conditions.
Average Peak Sun Hours by State:
- Most U.S. states experience 3 to 5 peak sun hours per day.
- States like Arizona (7-8 PSH) and California (5-7.5 PSH) lead in solar radiance.
Determining Solar Feasibility:
- If your home receives at least 4 peak sun hours daily, investing in solar panels is highly beneficial.
- Consult a solar installer for a personalized assessment considering factors like equipment type, size, and orientation.
Unlock the full potential of solar energy by leveraging peak sun hours and precise solar mapping tools tailored to your location.
More from
Solar News
category

